

A significant number of LEGO minifigures are created to represent characters from TV series or films. LEGO has been creating Star Wars minifigs since 1999, and has created a total of 1,276 as of July 2022. Some characters have many minifigs, while others do not have any. In some cases, it makes sense that more prominent characters would have more minifigs. For example, Luke Skywalker has 55 minifigs and is also a very central character to the entire series, while Snap Wexley, a minor character, has 2. However, in some cases, there seems to be a mismatch between prominence and number of minifigs. One instance of this is the fact that Boba Fett has only 5 minutes of screen time and 17 minifigs, while Rey Skywalker has 131 minutes of screen time but only 4 minifigs. In this analysis, we explore the relationship between screen time and number of minifigs for 101 characters across the main Star Wars films (Episodes 1-9, Solo, and Rogue One) as well as how gender plays into this relationship.
We explored these relationships using screen time data by character from IMDB and minifigs data from BrickLink. We filled in gender and species information for each character with the help of Star Wars enthusiast and connoisseur Thorin Finch.
We found that in general, screen time correlates fairly closely with the number of minifigs a character has. However, the number of minifigs for feminine characters is disproportionately lower than the number of minifigs for male characters. Star Wars is a very male-dominated series, so it makes sense that there are more male minifigs. Yet, when comparing the percentage of screen time allocated to feminine versus masculine characters to the corresponding gender percentages of minifigs, it becomes clear that LEGO’s production of Star Wars minifigs has a bias in favor of masculine characters.
Gender Comparisons: All Films Combined
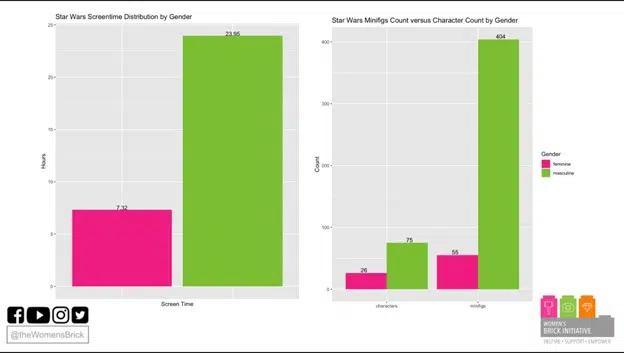
The bar charts below show the gender distributions of screen time, number of characters, and number of minifigs for all films combined. We can see that the masculine category is much higher for screen time (left most), characters (middle), and minifigs (right most). These minifig counts include minifigs within all subcategories of Star Wars minifigs on BrickLink (including categories outside of the main films).
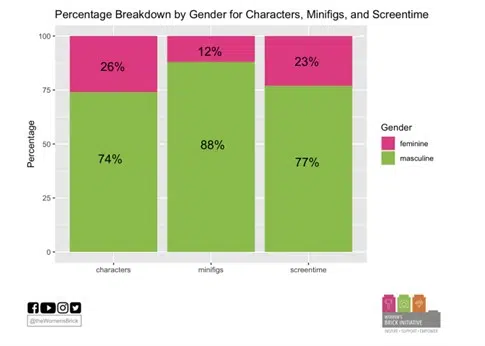
In order to more easily make comparisons across characters, minifigs, and screen time, the bar chart below shows the gender breakdowns for each by percentages. Interestingly, the percentages for characters and screen time are almost identical (roughly 25% feminine, 75% masculine), and yet the minifig percentages show a far greater gender disparity (12% feminine, 88% masculine). The percentage of female minifigs is less than half of the percentage of screen time allocated to female characters!
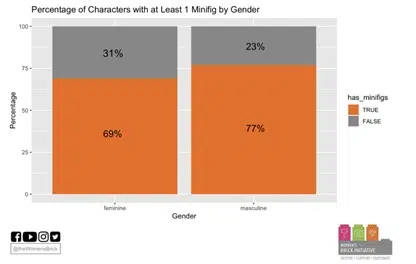
The bar chart below offers a slightly different perspective by portraying the overall percentages of male versus female characters that have at least one minifig. We can see that a larger percentage of male characters have at least one minifig, yet the disparity is not as great as when looking at the number of minifigs by gender.
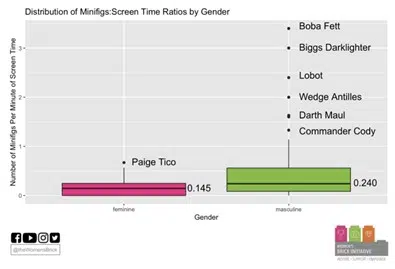
The boxplot below shows the distribution of the number of minifigs per minute of screen time for masculine versus feminine characters. The median ratio for feminine characters is 0.145 as compared to 0.240 for male characters. In other words. There is about 1 minifig per 7 minutes of screen time for each female character, while there is about 1 minifig per 4 minutes of screen time for each male character. This is a fairly large disparity, as it takes almost double the amount of screen time for LEGO to create a new minifig for a feminine character as compared to a masculine character. Furthermore, there are several male characters that have an extremely disproportionately high number of minifigs given the amount of screen time that they have. Boba Fett, having the highest ratio, has over 3 minifigs per minute of screen time! In contrast, the highest ratio for a feminine character (Paige Tico) is 0.67 minifigs per minute of screen time.
Gender Comparisons By Era
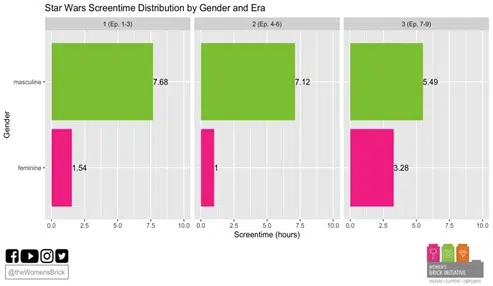
When we break it down into eras (era 1 = episodes 1-3, era 2 = episodes 4-6, era 3 = episodes 7-9), we can see that there are significant differences in representation across time. As shown by the left-most bar chart, the screen time allocated to male versus female characters becomes much more equitable in era 3. This is mainly the result of the introduction of the prominent female character Rey Skywalker.
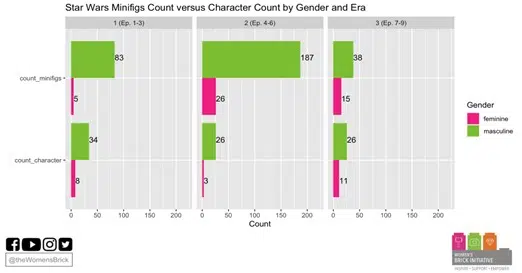
Looking at the right-most bar chart, it is notable that the vast majority of minifigs are minifigs representing characters from era 2. This may be in part because era 2 includes the original and most classic Star Wars films. These minifig counts include only minifigs within the subcategories devoted to each episode on BrickLink (subcategories Episode 1, Episode 2, etc.) within the broader category of Star Wars minifigs.
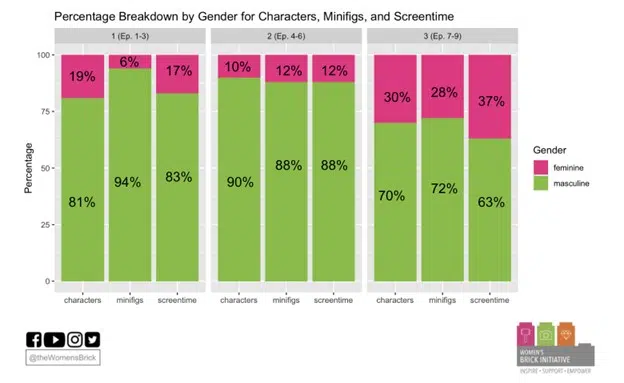
Looking at the percentage breakdowns, it is notable that the disparity between gender percentages for minifigs as compared to corresponding percentages for screen time is by far the greatest for era 1. Surprisingly, the disparity becomes much less when looking at eras 2 and 3 individually.
Relationship Between Screen Time and Number of Minifigs
The scatter plots below provide a more nuanced view of the relationship between screen time and number of minifigs by gender. Each point on the plot represents a unique character.
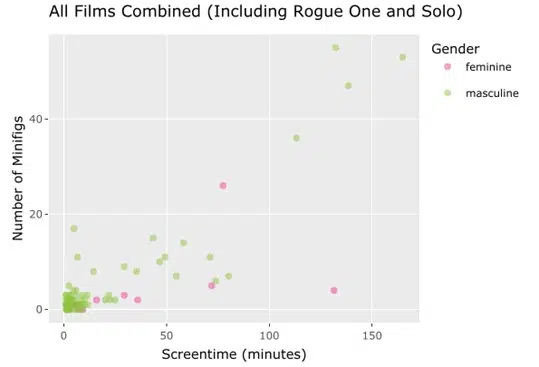
For all films combined, we can see that as screen time increases, the number of minifigs also increases in general. However, when we look at female characters compared to male characters, it is clear that the number of minifigs remains low even as screen time increases.
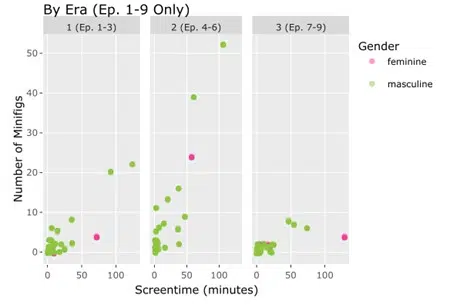
When splitting it up by era, it is notable that for era 2, the number of minifigs increases at a much greater rate as screen time increases, while for era 3, the same barely increases at all as screen time increases. The trend for era one most closely resembles the trend seen in the combined data.
To explore an interactive version of these scatter plots, check out this shiny app.
Overall, this analysis reveals that the Star Wars minifigs are disproportionately skewed in favor of male characters when comparing to the gender breakdowns of screen time and number of characters within the main films. However, we do see apparent differences by era, with the greatest disparity existing in era 1. It is also important to note that era 3 is much more recent than eras 1 and 2, so LEGO has not released as many minifigs for this era simply because it has been around for fewer years. LEGO began producing Star Wars minifigs for eras 1 and 2 over 20 years ago around 1999, while the first movie of era 3 only was released 7 years ago in 2015. It will be interesting to see how these trends develop as more and more Star Wars sets are released each year. Will gender representation in LEGO minifigs catch up to the increasingly equitable gender representation in Star Wars films? Only time will tell.
Stay tuned for Part 2 where we will analyze these relationships between screen time, number of minifigs, and gender for several of the Star Wars TV series including The Book of Boba Fett, The Mandalorian, Rebels, and Clone Wars.