
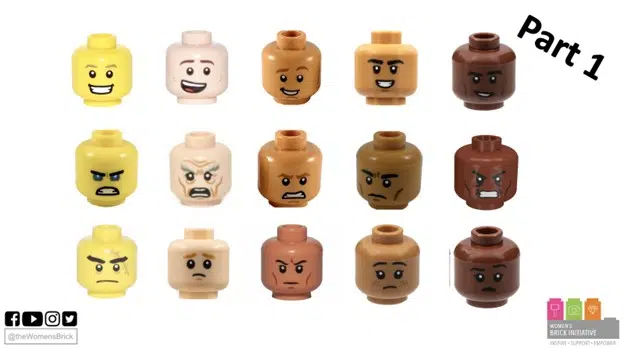
LEGO has produced over 3500 different minifigure heads over the past 44 years (1978-2022), and yet it may still be difficult to find one that looks like you– representing your skin tone, gender, age, and the emotion you are feeling at any given time. In this analysis we explore the diversity of these heads and how the representation has changed over time using data from Bricklink.
We investigated diversity across the following variables:
- Gender (three categories: male, female, and neutral)
- Age (three categories: child, young adult, and older adult)
- Flesh Tone Color (five categories: Yellow, Light Nougat, Nougat, Medium Nougat, and Reddish Brown)
- Emotions (ten categories: happy, angry, sad, annoyed, evil, scared, sleepy, smirk, surprised, and neutral).
Overall, the vast majority of options represent white, young adult males. However, gender representation as well as diversity of flesh tone options have improved significantly over time.
This analysis is an expansion of our previous analysis from last year (2021) including the new heads released in the past year. We also expanded our gender categorization to include “neutral” heads rather than boxing them all into the binary labels of “male” and “female”.
We classified the gender, age, and emotion of each head using keywords in the descriptions first, and then going through manually to double check for errors. The classifications are defined as follows:
- Gender:
- Male if descriptions contains:
“beard”, “goatee”, “sideburns”, “moustache”, “stubble”, ” male”, “mutton chops”, “whiskers”, “muttonchops”, “soul patch”, “bushy”, or includes a male character name
- Female if description contains:
“female” or includes a female character name
- Neutral otherwise
- Age:
- Child if description contains:
“child”, “baby”, “toddler”
- Older Adult if descriptions contains:
“age lines”, “crow’s feet”, “wrinkles”, “laugh lines”, “eye bags”, “gray eyebrows”, “facial lines”, “cheek lines”, “forehead lines”
- Young Adult otherwise
- Emotion
- Happy if description contains: “smile”, “grin”, “happy”
- Angry if description contains: “angry”, “grimace”
- Sad if description contains: “sad”, “worried”, “concerned”, “confused”, “frown”
- Annoyed if description contains: “annoyed, “scowl”, “sneer”
- Evil if description contains: “evil”, “vicious”
- Scared if description contains: “scared”, “terrified”
- Sleepy if description contains: “sleepy”, “asleep”
- Smirk if description contains: “smirk”, “lopsided grin”, “raised eyebrow”
- Surprised if description contains: “surprised”
- Neutral otherwise
Although there are more flesh tone colors available now than the five mentioned, we have chosen to exclude the newer/more rare ones for simplicity since they represent such a tiny percentage of all heads. We have grouped all Dark Orange and Medium Brown heads in with the Reddish Brown heads for this reason.
It is also important to note that this analysis includes only human heads with faces (i.e., no aliens, skulls, plain monochrome heads with no face, or non-human creatures). After filtering out the non-human faces, there were 2,331 total heads.
Gender-Color Distribution
The bar charts below display the flesh tone color breakdowns by gender, with counts on the left and color percentages on the right. We can see that the number of male heads is more than the number of female and neutral heads combined! It is also clear that light flesh tone colors dominate, while darker flesh tones represent a miniscule percentage for all genders.
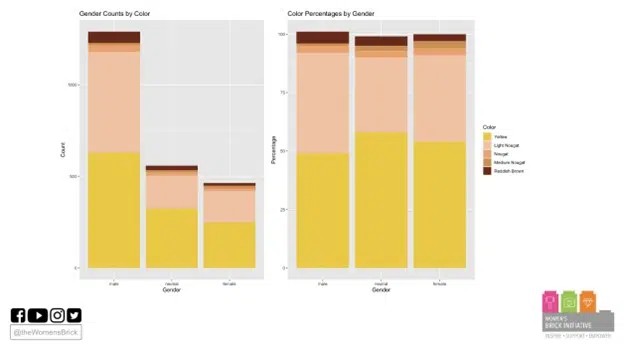
Note: For all bar charts, it may appear that the percentages do not add up exactly to 100% because percentages have been rounded to the nearest whole percent.
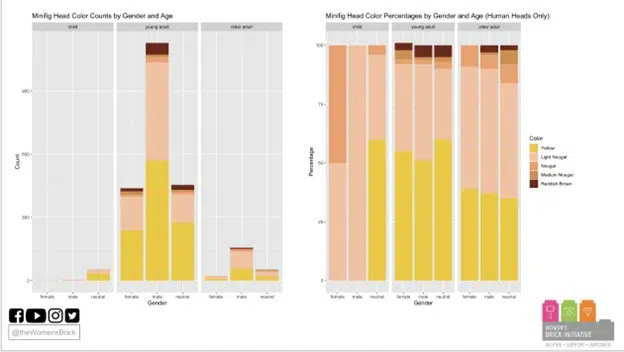
Gender-Color Distribution by Age
The bar charts below show the gender-color distributions split up by age group. It is notable that the vast majority of the heads are young adult heads for all genders. Looking at just child heads (left most), most child heads do not have gender-specific characteristics, and there are no child heads of color (i.e., no child heads with flesh tones darker than light nougat or yellow). For older adult heads (right most), there are very few female options, and no female heads in Medium Nougat or Reddish Brown flesh tones. The color distribution for young adult heads (middle) is similar to the overall distribution for all age groups combined as shown in the bar chart above.
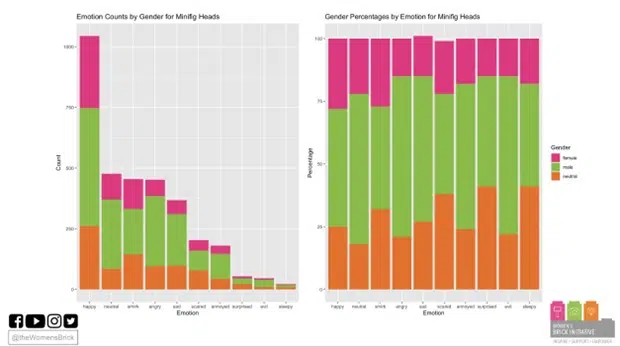
Emotion Distribution by Gender, Color, and Age
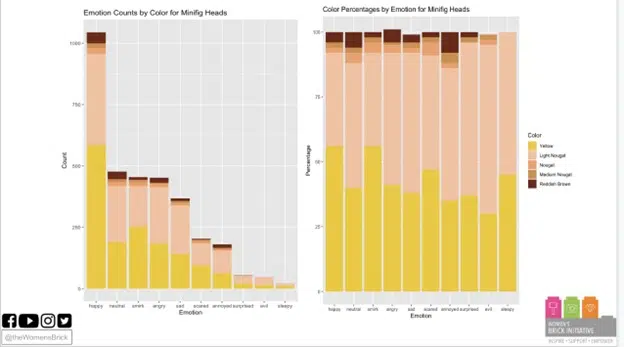
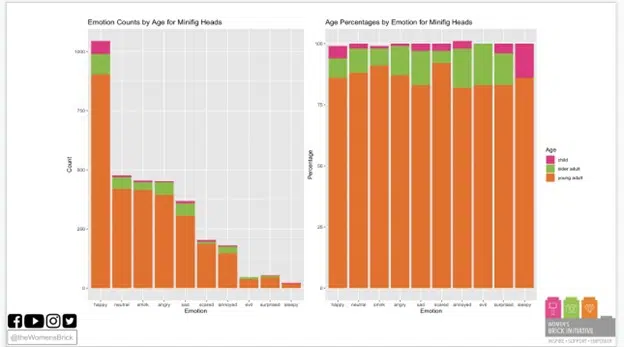
The three sets of bar charts below show the distribution of facial expressions by gender, color, and age, respectively, with counts on the left and percentages by emotion on the right. For this section of the analysis, we counted dual-sided heads (heads that have one expression on the front and a different expression on the back) as two separate heads. This brought the total number of heads up to 3,300.
We can see that the most common emotion by far is ‘happy’, which makes sense because it is a generic emotion as compared to the three least common– ‘sleepy’, ‘evil’, and ‘surprised’–, which are more specific.
When looking at the breakdowns by gender, color, and emotion, the distributions by emotion appear fairly even. There is no one emotion that stands out as having disproportionate representation for a specific gender, color, or age sub-group. It is notable, however, that the emotion that clearly has the highest percentage of Reddish Brown heads is ‘annoyed’. There is not an extremely high percentage in this category, yet it is visibly higher than the percentage of Reddish Brown heads in any other emotion category (roughly 7% as compared to roughly 2-5% in other categories). This may be a reflection of the discriminatory stereotype that Black people are rude or have an attitude.
Trends in Representation Over Time
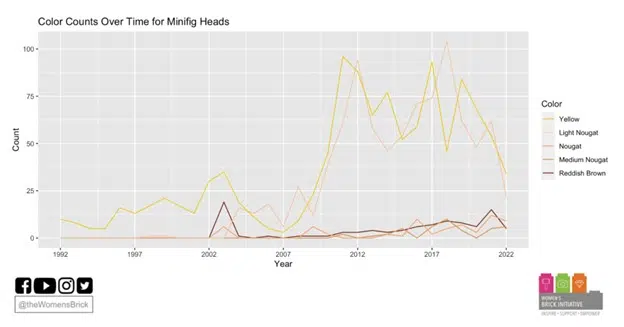
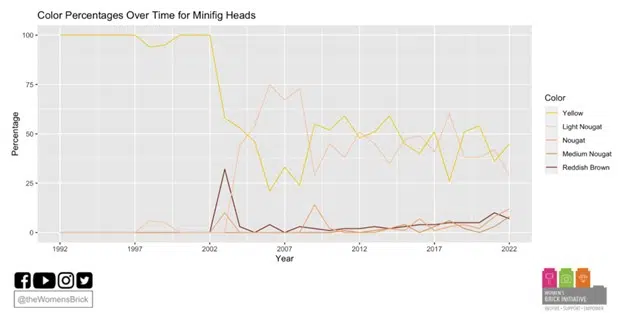
Color Trends
The two line graphs below display change over time in color counts (first) and percentages (second) for heads released over the past 30 years (1992-2022). We can see that for the first several years, only yellow heads were available. We see a few light nougat heads appearing in the 1990s, but the broader shift toward creating minifigs in flesh tone colors was initiated in 2003 with the introduction of a Lando Carlissian minifig, the first minifig of color, as part of the Cloud City Star Wars set.
Although we do see the numbers of darker flesh-colored heads increasing in recent years, the options available for yellow and light nougat heads are much more numerous than those available for darker flesh tones even today.
Starting around 2007, we see a steep increase in the total number of heads released per year. Yellow and Light Nougat heads both increase enormously, and although there are slight increases in the other flesh tones also, they are not nearly as large.
Although LEGO’s choice to start creating minifig heads with realistic flesh tone colors was a step in the right direction toward diverse representation, their choices of how many heads of each color to produce further highlights their bias toward representing white people over people of color. Originally, they claimed that yellow was meant to represent all people regardless of race, and yet even once they introduced realistic flesh tones, the number of Light Nougat heads released has dominated the numbers of any other flesh tone. In this way, the under-representation of people of color has become even more pronounced now that flesh tone colors exist.
We can see the continuing inequity clearly when looking at the percentages version of the line graph below. The percentage of yellow heads dropped from 100% to close to 50% when flesh tone heads were introduced more widely from 2003 onwards, and yet it has been mostly light nougat heads accounting for the percentage decrease in yellow heads. The yellow and light nougat lines have each hovered around 30-60% while each of the lines representing darker colors have mostly remained below 15%.
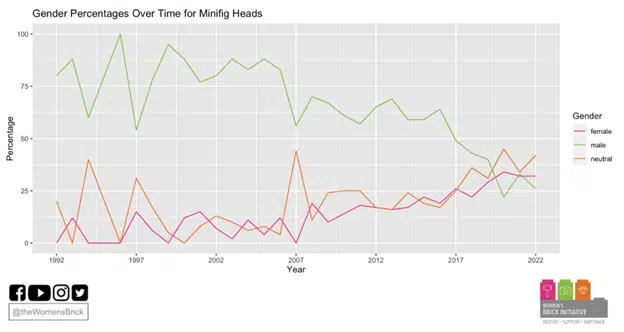
Gender Trends
The two line graphs below display change over time in gender counts (first) and percentages (second) for heads released over the past 30 years (1992-2022). We can see that male heads have been more prevalent than both female and neutral heads for most of LEGO history. However, from around 2007 onwards, the trend has been toward gender equity. Looking at the most recent two or three years, the percentages of male, female, and neutral heads all appear nearly equal!
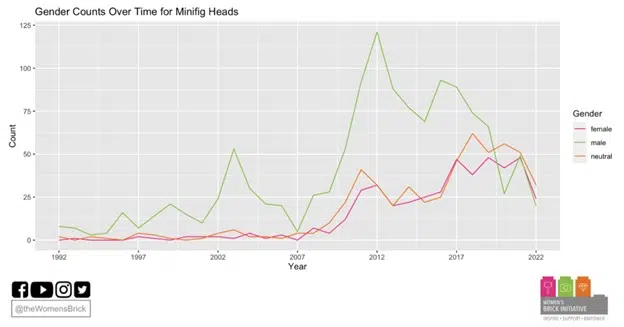
For all four line graphs, we chose to start at 1992 because this was the first year in which minifig heads began to be released consecutively each year. Between 1978-1992, there were a few heads released sporadically, and yet the production became more continuous from 1992 onward. The few heads released before 1992 were all yellow. Also, we excluded 109 heads that had missing release dates, which brought our total head count down to 2,222.
Does Diversity of Minifig Heads in Stores Match the BrickLink Data?
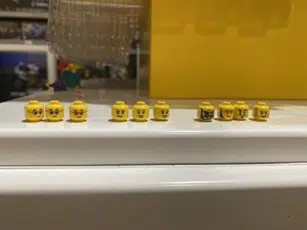
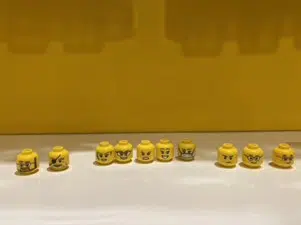
A couple of weeks ago, I happened to be in a LEGO store in Staten Island, NY, and I decided to do an experiment: Out of the huge bin of minifig parts available at the Build-A-Minifig station, I randomly picked out 10 heads without looking and counted how many were male, female, and neutral (all heads available were yellow, so I could not test flesh tone representation). I was pleasantly surprised to learn that the options available in the store did seem to be gender-equitable! I did the experiment twice. The first time the distribution was four male, three female, three neutral. The second time, it was two male, five female, three neutral (even over-representation of females!). These outcomes align with what the line graph above (using BrickLink data) shows– the gender percentages for heads are roughly equal in 2022. Although the lack of diverse flesh tones is still a major area of improvement, it is encouraging to see that even in stores, the gender representation for Build-A-Minifigure heads is approximately equitable!
If minifigs are meant to represent people living in the world, everyone deserves to see themself represented. Currently, white, young adult males are very over-represented while all other demographics are under-represented. The trends in gender representation over time are encouraging in that they do show a commitment by LEGO toward gender equity. However, LEGO has much more room for improvement in representation of diverse flesh tones. We did not look at trends over time in age representation, yet the overall numbers tell us that young adults are over-represented while children and young adults are under-represented. It is a huge area of improvement in itself that no child heads of color exist.
Check out [Part 2] to see a more detailed and comprehensive table of the number of options for each gender-age-color-emotion combination so that you can check out exactly how many options you have for representing yourself!